
Change Impact Assessment Part 2


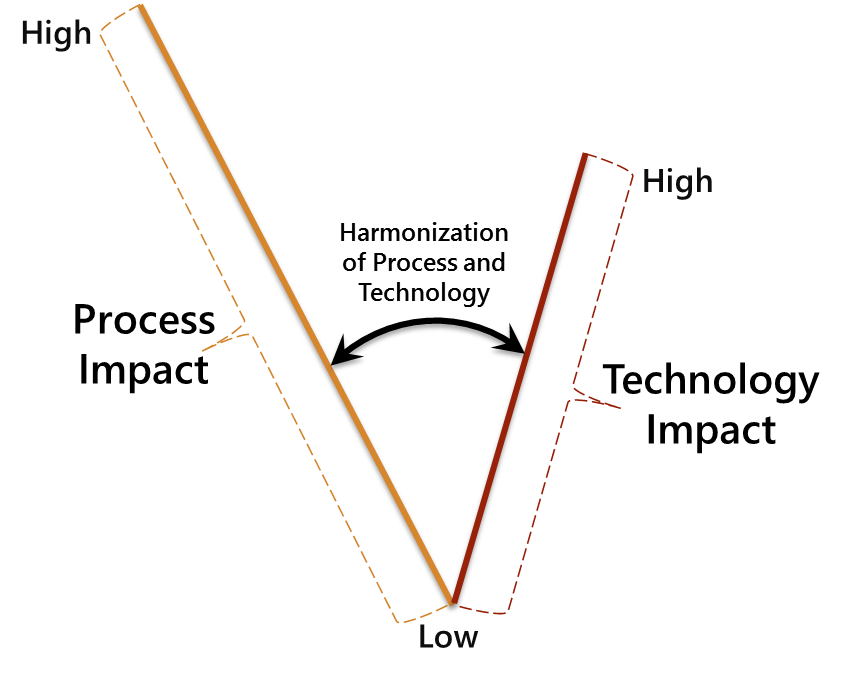
In Part 1 of this article numeric scores were developed to assess the magnitude and impact of potential process and technology changes associated with a large program of work. A third metric, Harmonization, was developed as a measure of how closely the process and technology changes were related. A low harmonization score implied the two were closely related. A higher score implied less relationship between the two. The basis for this was that closely related process and technology changes would have less impact on people as they could be assimilated easier.
Tabulated scores for each workflow and department were prepared as shown in the sample data table below:
Workflow # |
Department |
Harmonization Score |
Process Impact |
Technology Impact |
|---|---|---|---|---|
| 1 | A | 45 | 4 | 7 |
| 1 | C | 60 | 5 | 8 |
| 1 | D | 30 | 4 | 8 |
| 2 | B | 45 | 3 | 6 |
| 2 | D | 60 | 4 | 5 |
| 3 | A | 15 | 8 | 6 |
| 3 | B | 45 | 6 | 7 |
| 3 | E | 30 | 6 | 8 |
| 4 | B | 75 | 7 | 5 |
| 4 | C | 60 | 7 | 4 |
| 4 | E | 45 | 6 | 4 |
These scores provided enough data to estimate the people impact as represented by the third side of the triangle. The area within the triangle was used as a projected measure of the total change impact (process, technology, and people impact). Total impact calculations were made using trigonometry formulas. The updated table of sample data is shown below:
Workflow # |
Department |
Harmonization Score |
Process Impact |
Technology Impact |
People Impact Score |
Total Impact |
|---|---|---|---|---|---|---|
| 1 | A | 45 | 4 | 7 | 5.0 | 9.9 |
| 1 | C | 60 | 5 | 8 | 7.0 | 17.3 |
| 1 | D | 30 | 4 | 8 | 5.0 | 8.0 |
| 2 | B | 45 | 3 | 6 | 4.4 | 6.4 |
| 2 | D | 60 | 4 | 5 | 4.6 | 8.7 |
| 3 | A | 15 | 8 | 6 | 2.7 | 6.2 |
| 3 | B | 45 | 6 | 7 | 5.1 | 14.8 |
| 3 | E | 30 | 6 | 8 | 4.1 | 12.0 |
| 4 | B | 75 | 7 | 5 | 7.5 | 16.9 |
| 4 | C | 60 | 7 | 4 | 6.1 | 12.1 |
| 4 | E | 45 | 6 | 4 | 4.2 | 8.5 |
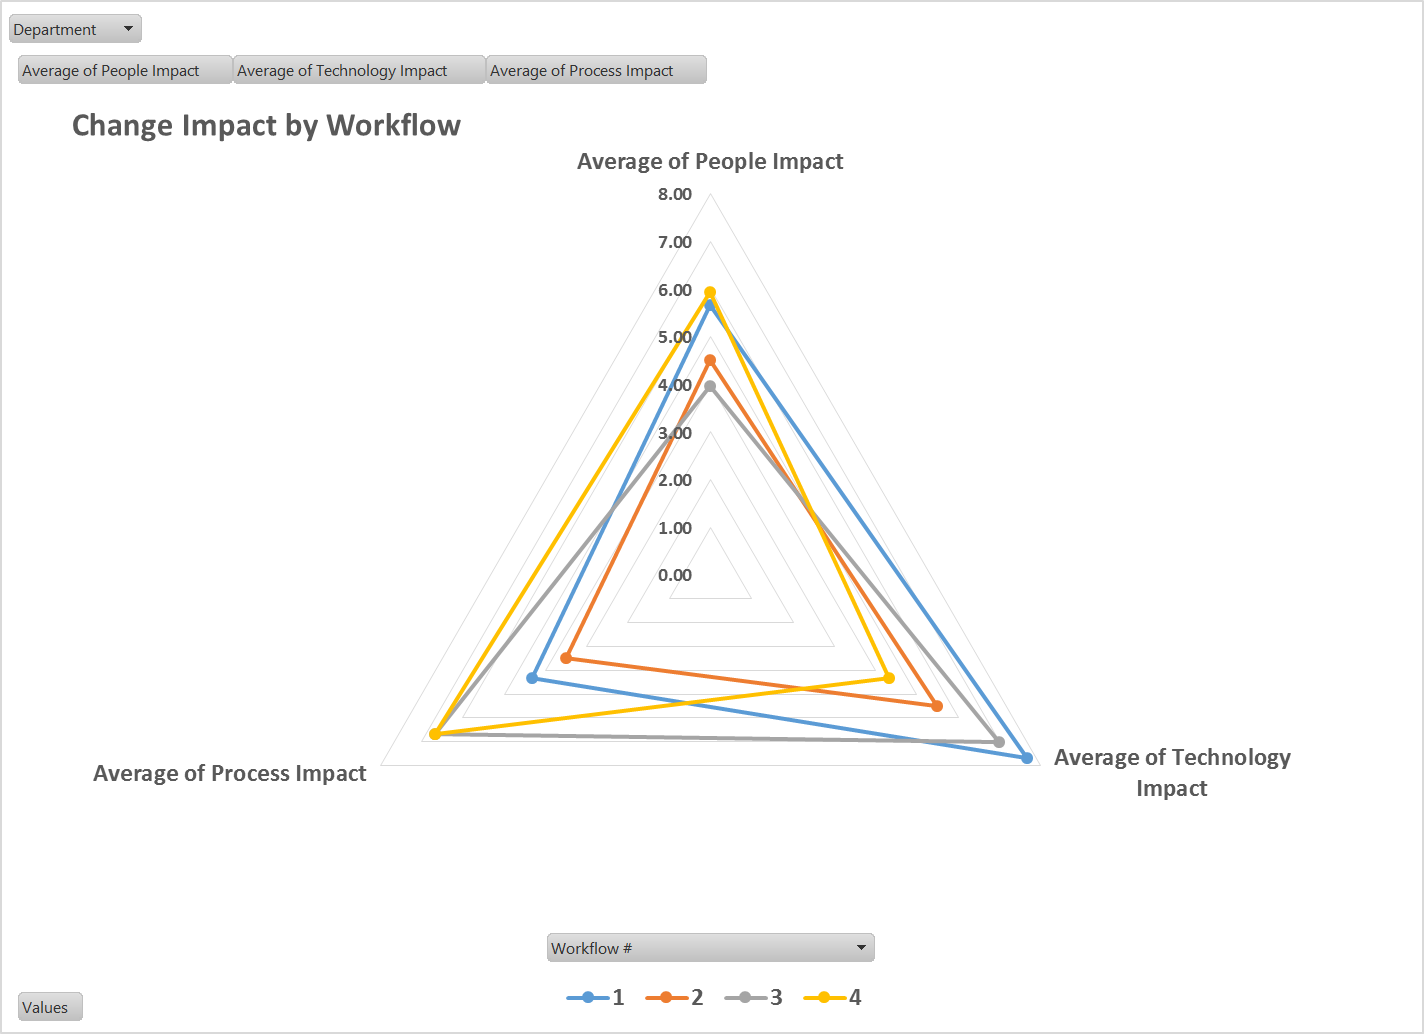
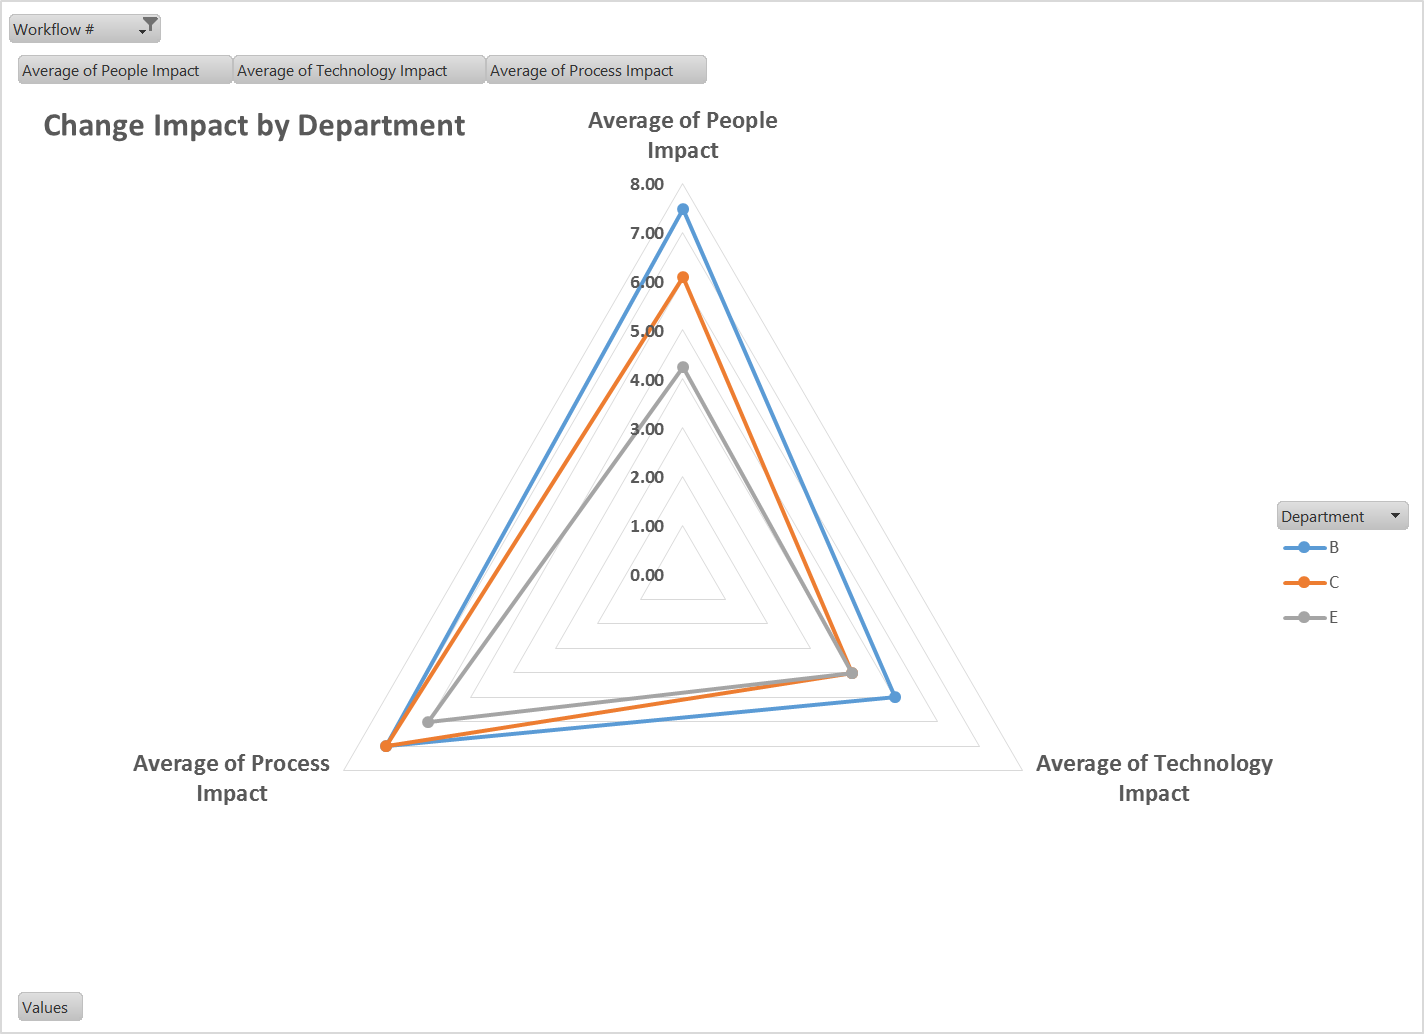
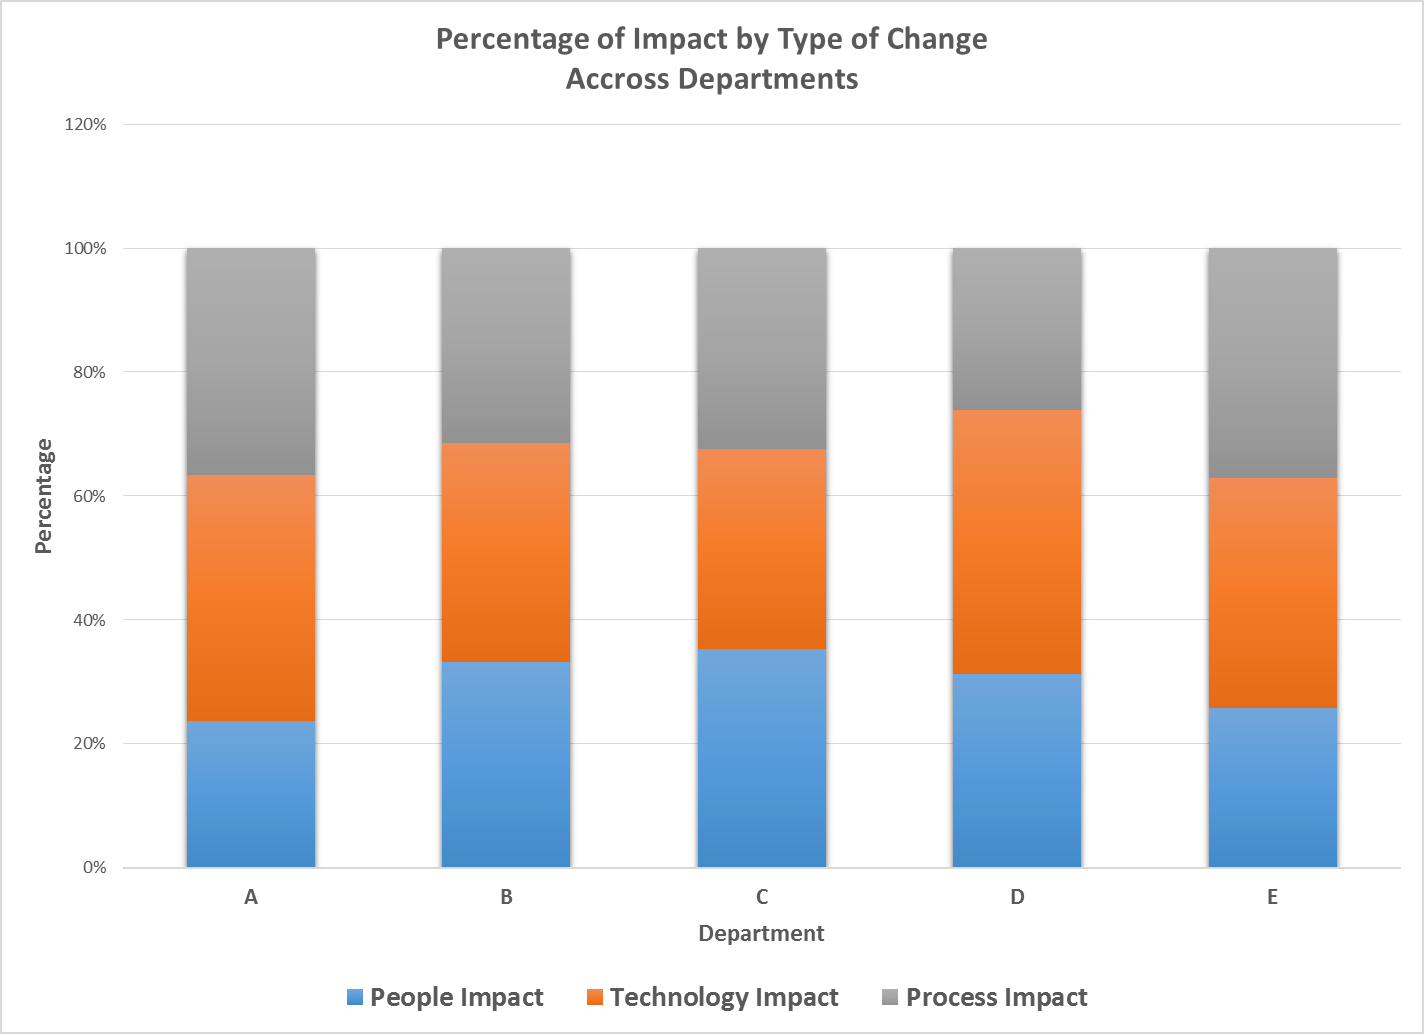
Summarizing and evaluating the data in tables and graphs provided a great deal of insight into where the change impact would be the greatest across the workflows and departments. Several samples of these analyses are shown below (click on an image to see a full size view):
 |
 |
 |
 |
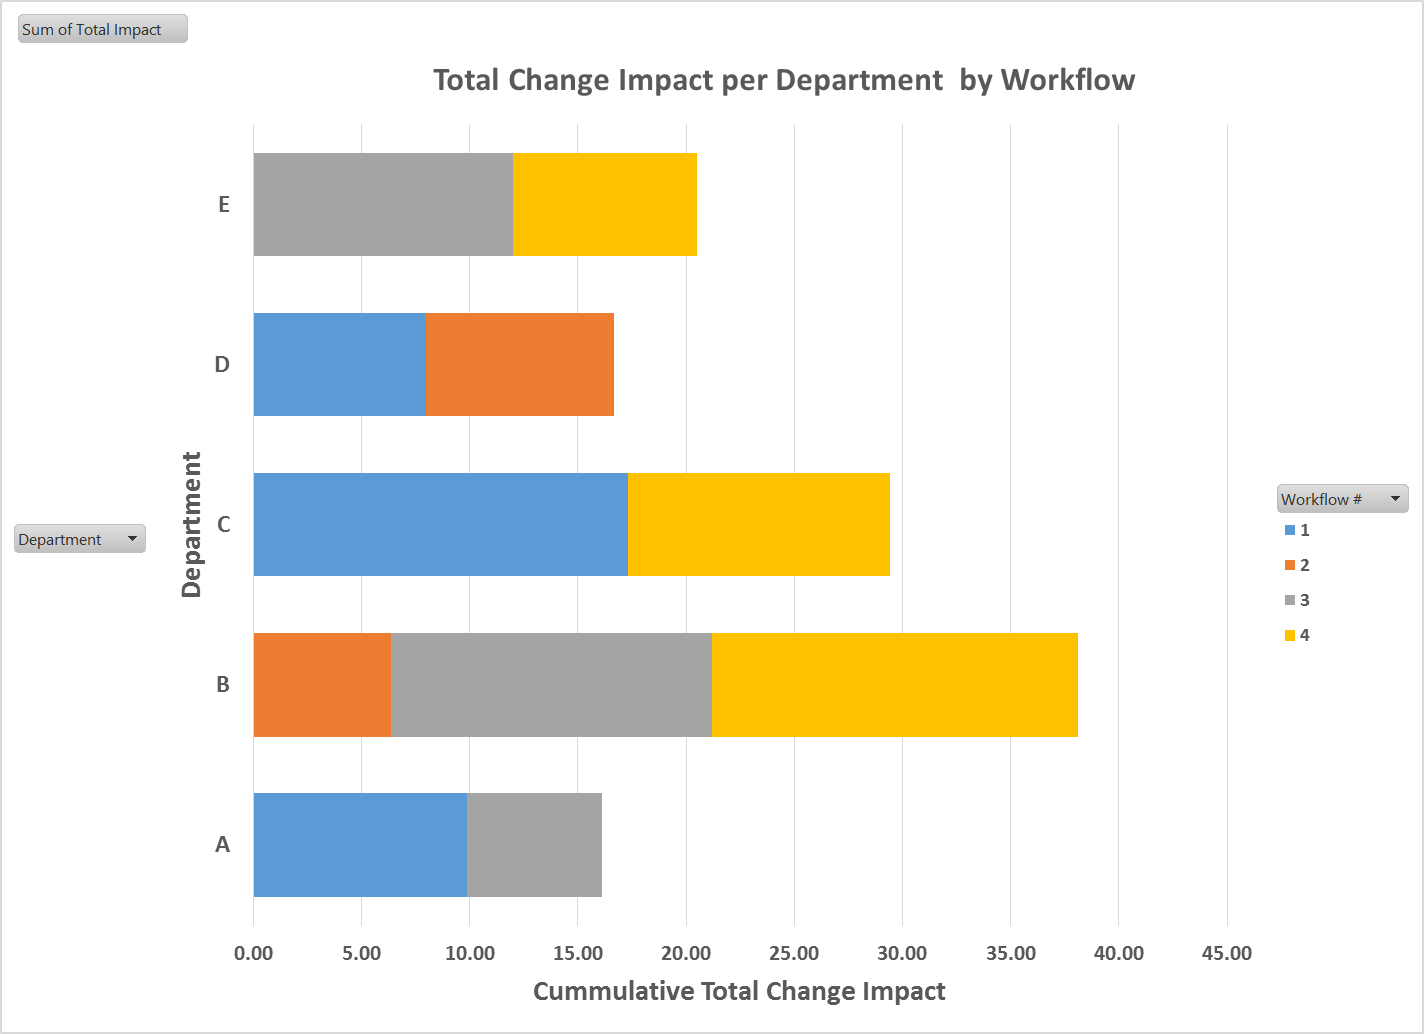
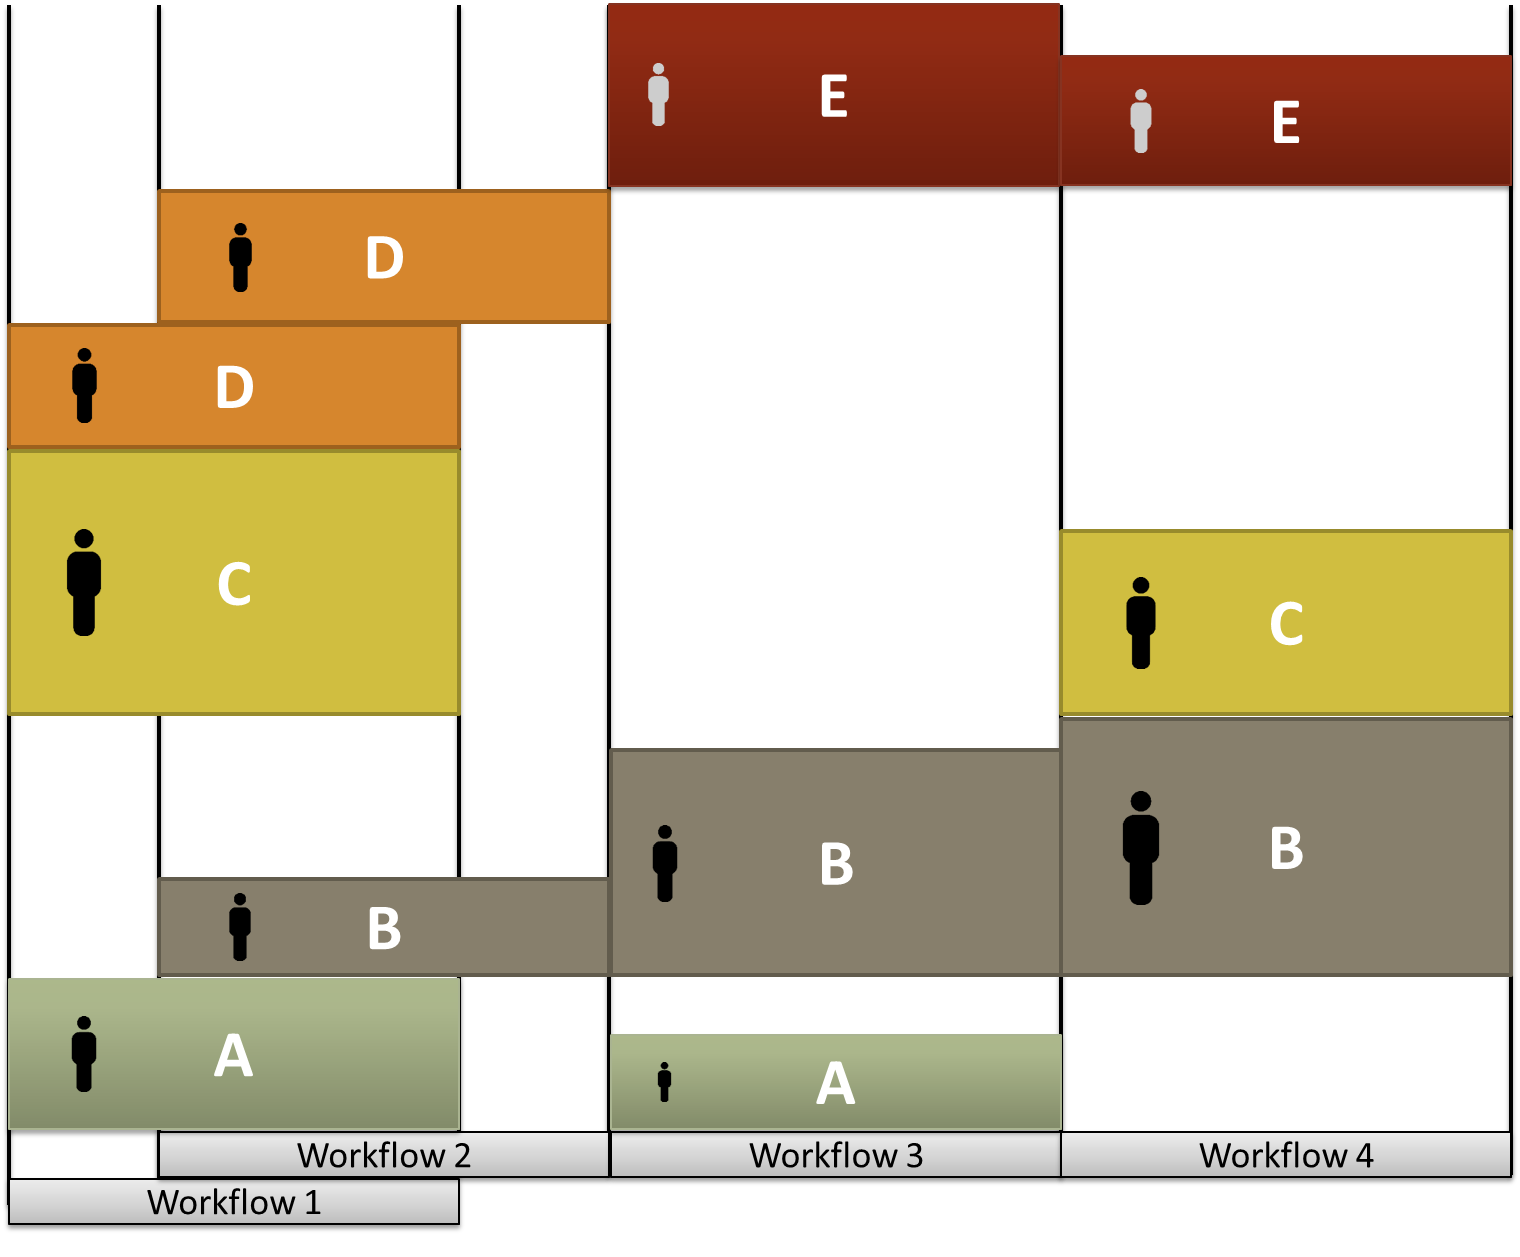
The analyzed data became extremely useful in laying out the implementation roadmap. Workflows 1 and 2 had to be implemented in conjunction with one another. Workflows 3 and 4 were dependent upon Workflow 1 being complete, but could be implemented either sequentially or simultaneously. The diagram below shows the relative total change impact on each department during each workflow implementation. The height of the small “people” icon represents the amount of people change impact relative to the total change impact (height of the box).
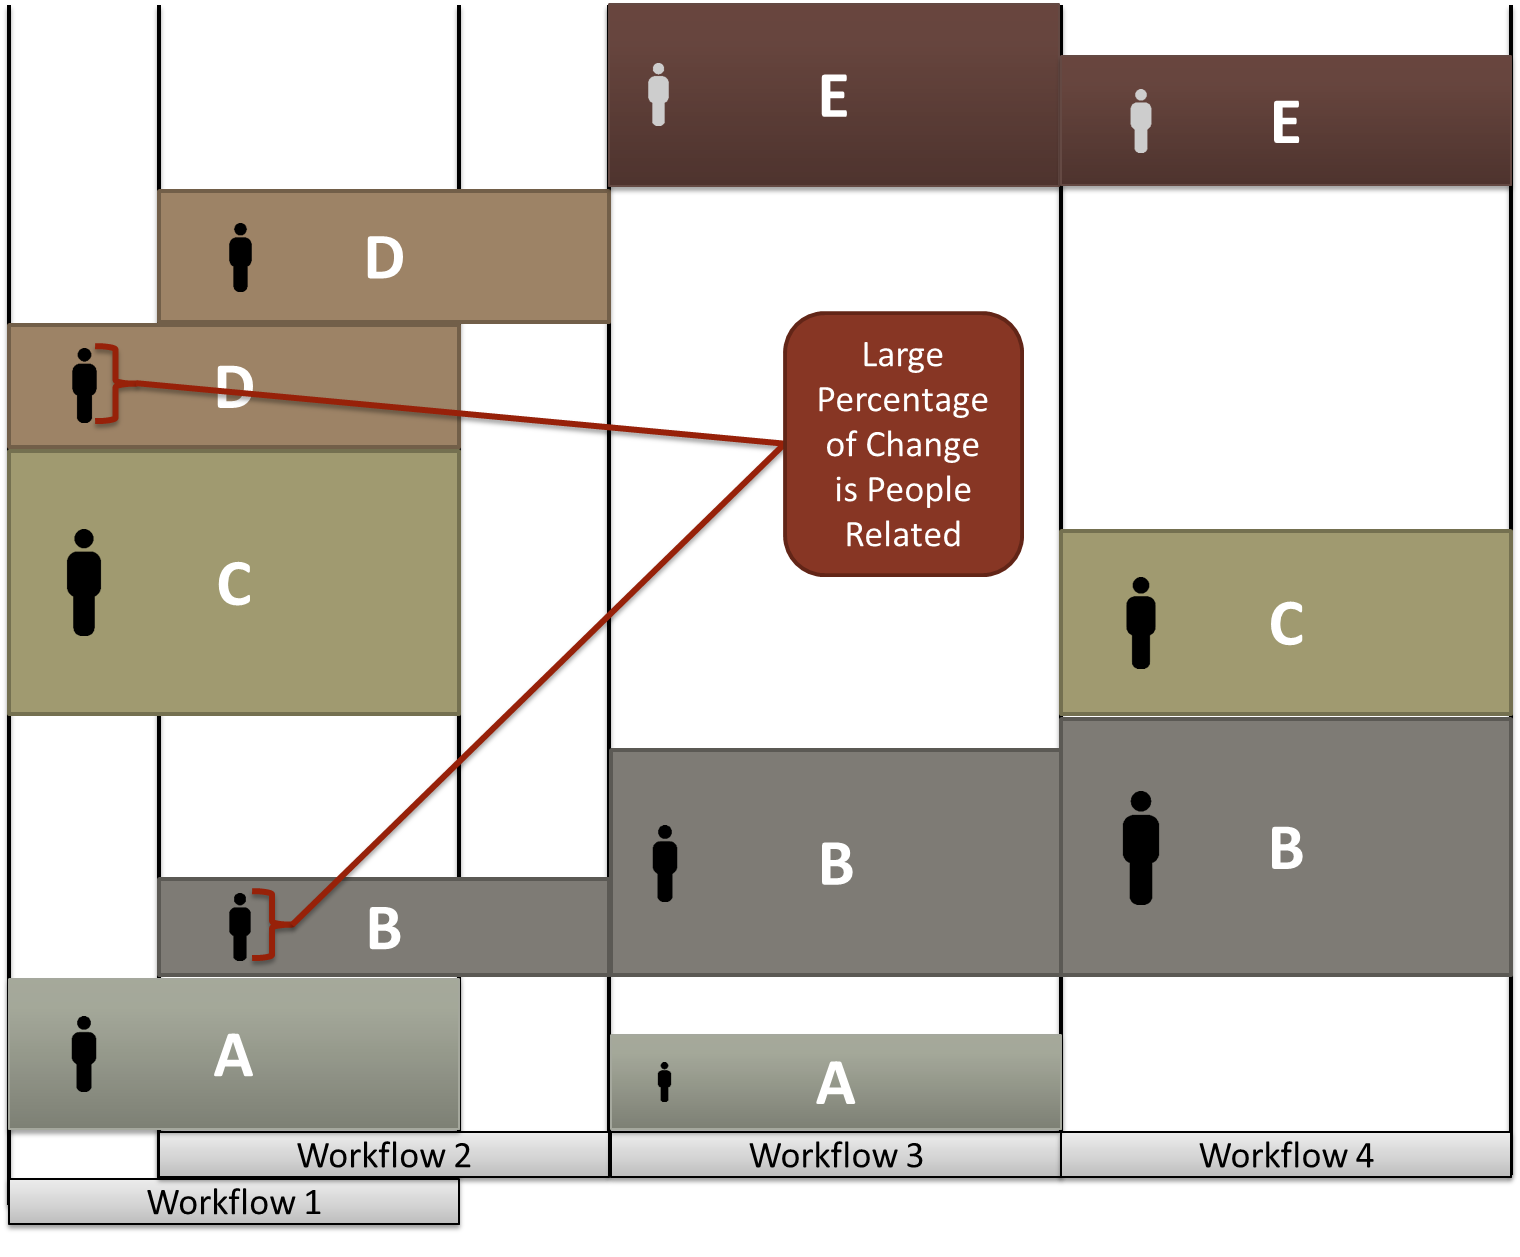
Because Workflows 2, 3, and 4 affected Department B sequentially, the decision was made to implement them sequentially. Other areas of concern were highlighted by the amount of people change relative to the total change. For example, Department B in Workflow 2 has a very high people change impact. This is also true of Department D in Workflow 1. The overlap impact on Department D was also a concern since they would be impacted by Workflow 2 implementation while Workflow 1 was still underway. These two examples are highlighted in the diagram below.
This change assessment model met the objective of senior management to provide an early assessment of change impact across the organization for the implementation of this project. It also provided a number of other benefits:
- The results helped senior management make important decisions to develop the implementation roadmap.
- Senior management and department heads had an early warning and ample time to plan for implementation to maintain service levels during that time.
- The preliminary assessments were part of the design discussions and used to look for opportunities to reduce change impact by additional process / technology harmonization.
- The preliminary assessments were reviewed at the end of the design phase for any adjustments to the estimates so that they could be used for further change impact analysis prior to implementation.
- The change management effort was jumped started with the preliminary assessment data to begin planning the overall change management effort and begin to address areas of major impact.
- The training department used the change impact assessments to prioritize training content for departments and workflows of greatest change.