
Create a Roadmap with Value

A roadmap is a great visual communications tool. You can create program or project roadmaps, technology roadmaps, and others for specific purposes. Usually a roadmap depicts a series of actions, events, or initiatives over time. Sometimes, it simply shows a path that is to be followed. Most roadmaps show interrelationships between workstreams, departments, functional areas, or sub-projects. Roadmaps can show dependencies and milestones as well.
Too often, roadmaps are created as high-level project plans. A good roadmap should depict the project or business goals. In the example below, the roadmap includes business drivers, return on investment targets for each phase, and both current and future state key performance indicator (KPI) metrics. Color-coding also is used to differentiate between revenue growth and process improvement activities.
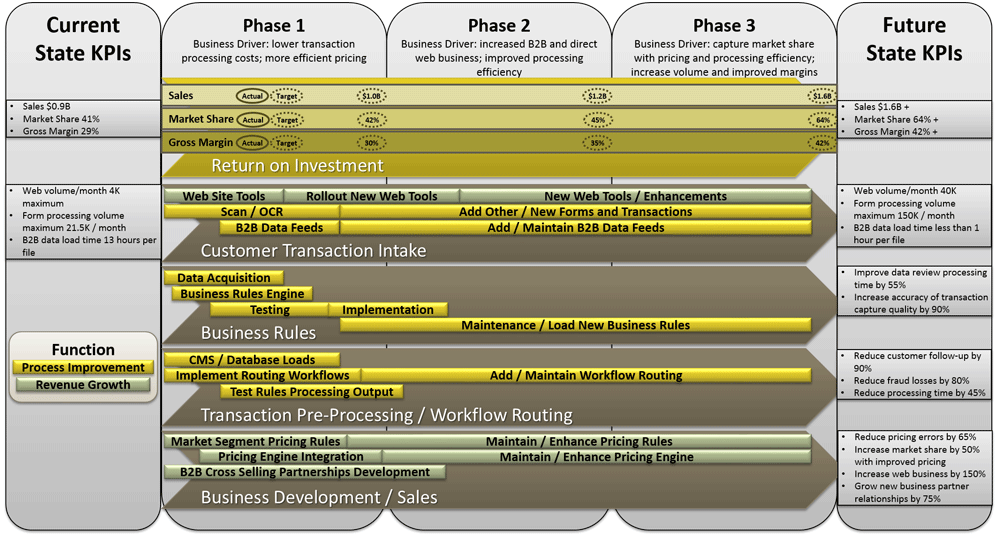
One of the major goals of any roadmap is to communicate the objectives of the project. The example above clearly communicates the business drivers for each phase. Also, the expected return on investment results are shown for each phase. Current KPIs are easily compared to show the expected results and the new KPIs that will be used to measure results.
One other technique that can be useful for reporting is to update any business goals and KPIs as the project progresses. If some goals are achieved over the course of the project, including target and actual KPIs for each phase, updating them can be useful.
Roadmaps can use overlays to show additional details and provide reference points. The same roadmap is shown below, but uses a different color-coding to display activities as being related to development, business/operations, or enhancements/maintenance.
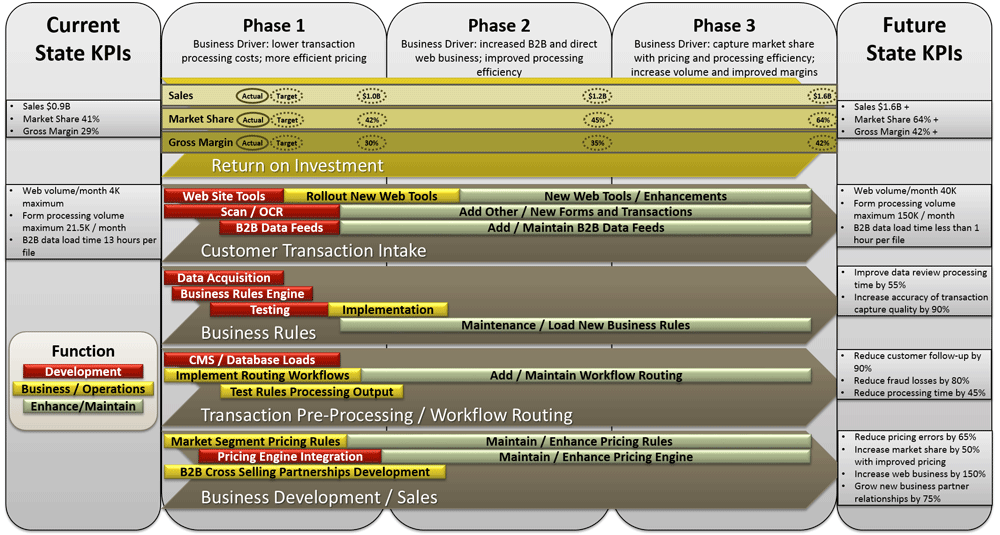
This particular view makes it clear that the bulk of the development and business/operations work is to be performed in phase 1 and early phase 2. This implies that the business results generated during phases 2 and 3 will come from the various enhancement activities. This was in fact the intention. Once phase 1 work was underway, new cycles of development and process improvement can be planned and scheduled for phases 2 and 3.
Roadmaps can and should be revised over time. If schedules slip or adjustments to workstreams or activities are needed, these can be updated. The roadmap also can be updated to show completed work, work in progress, and future work. These types of depictions are simply a matter of selecting a clear color or visual encoding scheme.
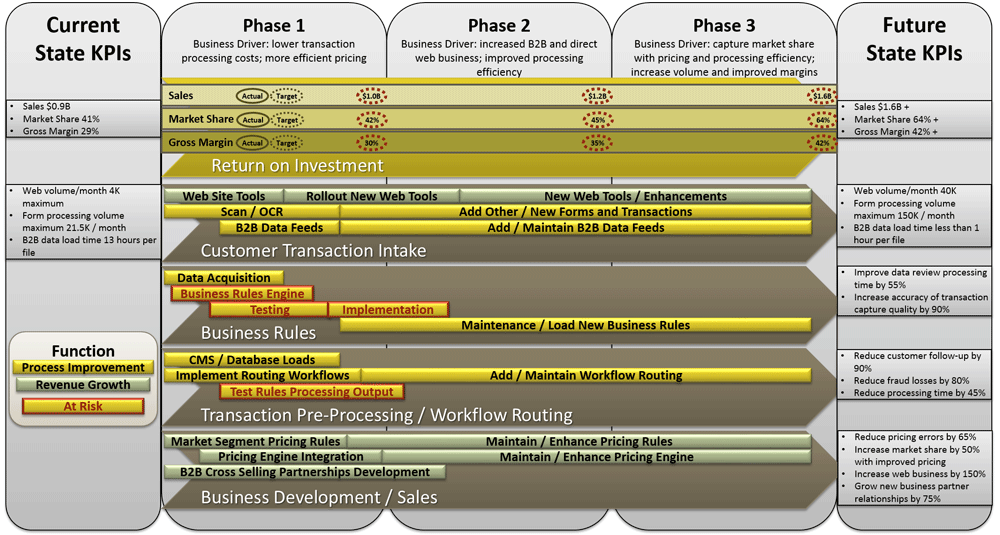
Another variation is to use the roadmap to display issue and risk data. Using our example, if the business rules engine activities ran into technical issues, there could be several slippages and the anticipated business results might be at risk. This could be depicted by highlighting the at-risk activities and results in red, as shown below. In this example, only a select set of red risk activities were highlighted. Further encoding could highlight not only red and yellow risks, but also financial, resource, and schedule risks.
There are dozens of other ways to use a roadmap. They can be used to focus on impact which may include customer impact, business or financial results impact, or impact on end-users. Roadmaps should be designed to highlight what is most important about your program of work or project. The key is to focus on the most important elements that need to be communicated and make sure they are visually clear.